
|
Buy:
|
100 Ideas for Secondary Teachers: Outstanding Computing Lessons
Bonus Activities: Data Science Detectives
Overview
“The ability to take data - to be able to understand it, to process it, to extract value from it, to visualise it, to communicate it - that’s going to be a hugely important skill in decades to come.” - Hal Varian (Google)
Data Science
At its heart, data science is all about solving problems. The ability to think analytically and to recognise patterns are not just key computational thinking skills, they are key employability skills too!
Data Science
At its heart, data science is all about solving problems. The ability to think analytically and to recognise patterns are not just key computational thinking skills, they are key employability skills too!
The curious case of John Snow
A famous example of pattern recognition, an essential component of data analytics, is the case of John Snow vs. cholera. John Snow, not to be confused with the character from Game of Thrones, was an English physician most famous for his work in tracing the source of a cholera outbreak in Soho, London, in 1854. At that time, cholera was believed to be spread through the air but, with the help of data visualisation, Snow was able to substantiate his theory that all the deaths could be attributed to a particular water pump used for drinking water. This information helped convince the local council to immediately remove the pump handle resulting in countless lives being saved!
Start by giving students a copy of the very same map used by John Snow along with testimonies of people living and working in the area at that time (see image below). Next, have the students ‘decompose’ the problem by dividing the city into zones and interrogating the data for each zone. Using pattern recognition, have the students narrow down the origin of the infections by identifying the zones with the earliest reported cases and highest density of infection rates. Then, using abstraction, have the students eliminate the unnecessary details from the interviews with the towns people taken at the height of the epidemic. Using all of the available data, the students should reach the same conclusion as John Snow but they should be encouraged to come up with their own innovative solutions to the problem.
John Snow highlighted on the map the position of a water pump on Broad Street. This data visualisation helped him to prove his theory that all the deaths had been of people who had used this water pump for drinking water. This map helped convince the local council to immediately remove the pump handle - resulting in many lives being saved.
Can your students come up with the same conclusion and what innovative solutions will they come up with?
Resources
Background information to share with the students:
In 1854 it was believed that a horrible disease called cholera was spread through the air. There was one scientist, however, who believed
that cholera entered the body through the mouth. His name was John Snow and he published his ideas in an essay called 'On the Mode of
Communication of Cholera'. In August, just a few years later, he was able to use data to prove his theory. There was an outbreak of
cholera in Soho in London. John Snow collected data, plotting each outbreak on a map.
Map
Provide groups of students with the following map (Original map by John Snow showing the clusters of cholera cases in the London epidemic of 1854, drawn and lithographed by Charles Cheffins.)
Instruct the students to look carefully at the map and ask the following three questions:
Provide groups of students with the following map (Original map by John Snow showing the clusters of cholera cases in the London epidemic of 1854, drawn and lithographed by Charles Cheffins.)
Instruct the students to look carefully at the map and ask the following three questions:
- Can you see the lines used to identify the outbreaks?
- What do you notice?
- Can you draw any conclusions from the map?
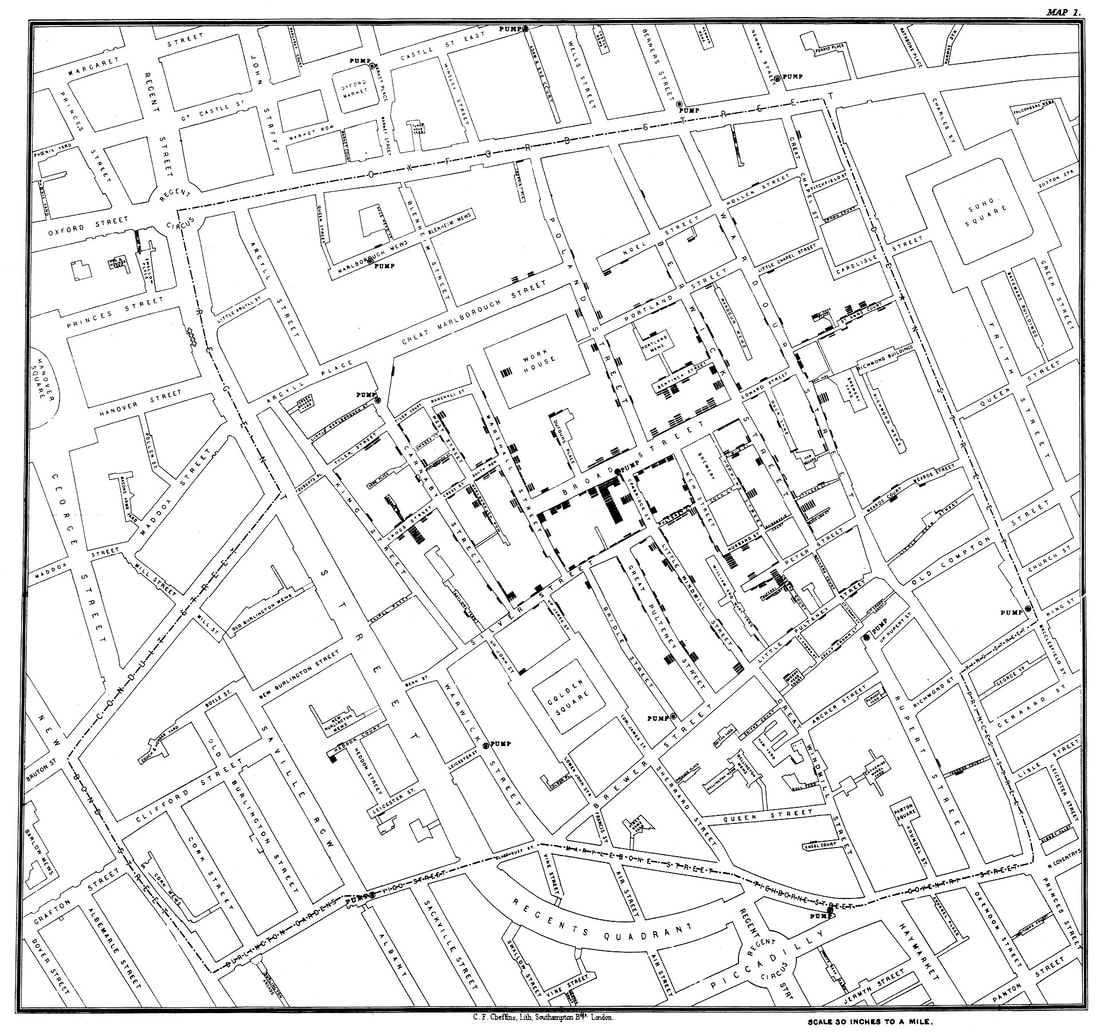
Image source: https://upload.wikimedia.org/wikipedia/commons/thumb/2/27/Snow-cholera-map-1.jpg/1920px-Snow-cholera-map-1.jpg
Licence: Public domain
Licence: Public domain
Useful information
On the night of the 31st of August, 1854, cholera broke out in the Soho section of London. It was, according to a local doctor, “the most terrible outbreak of cholera which ever occurred in the kingdom.” In a single night, doctors reported 56 new cases of cholera—all within a few blocks of each other. Before the outbreak was over, nearly 500 people had lost their lives.
In those days, people did not have running water in their homes. They carried in water from pumps located around the neighbourhood.
At the time, most people—even the best scientists—thought that cholera was spread through the air. But one local doctor did not agree. His name was John Snow. He believed that cholera was caused by a microbe and was spread by contaminated water. But at the time, no one knew how this terrible disease was spread. That’s what you are going to try to find out.
Interesting facts
The following people in the area were not dying of cholera at that time:
- Workers in the local brewery who only drink beer.
- None of the 545 prisoners at the workhouse have cholera! They also have their own water pump.